
Trading Trending Signals: April 2026 Jarvis Scorecard
April was an incredible month for a rebounding market, but traders are filling up social mediawith their feelings about the tweet turbulence emanating from the executive branch.
Unpredictable X announcements about oil transport or international peace talks are not what Jarvis was built to predict. But the resulting rebound in this month’s market gave way to someSPY signals that showcase the exact intent of Jarvis signals.
Not every Jarvis user trades options, but this month they showcased the force-multiplying powerof signals riding a strong positive market trend.
Note for non-options traders: With options, stock price (~$675) will correspond with anoptions contract price (~$1.10). The prior appears on the Jarvis chart visuals. The latter isincluded in our journal entries, and can be verified with retroactive On-Demand charts in appslike ThinkorSwim.
Trade examples are hypothetical and applied retroactively to demonstrate the Jarvis strategy. Trades were not executed in a live account. Results do not account for liquidity, slippage, or fees.
TRADE 1
Day Trade Options | Timeframe: 1M SPY Call | Apr 2 | 9:47 am – 10:50 amC676 $1.10 → $5.32 | 383% profit
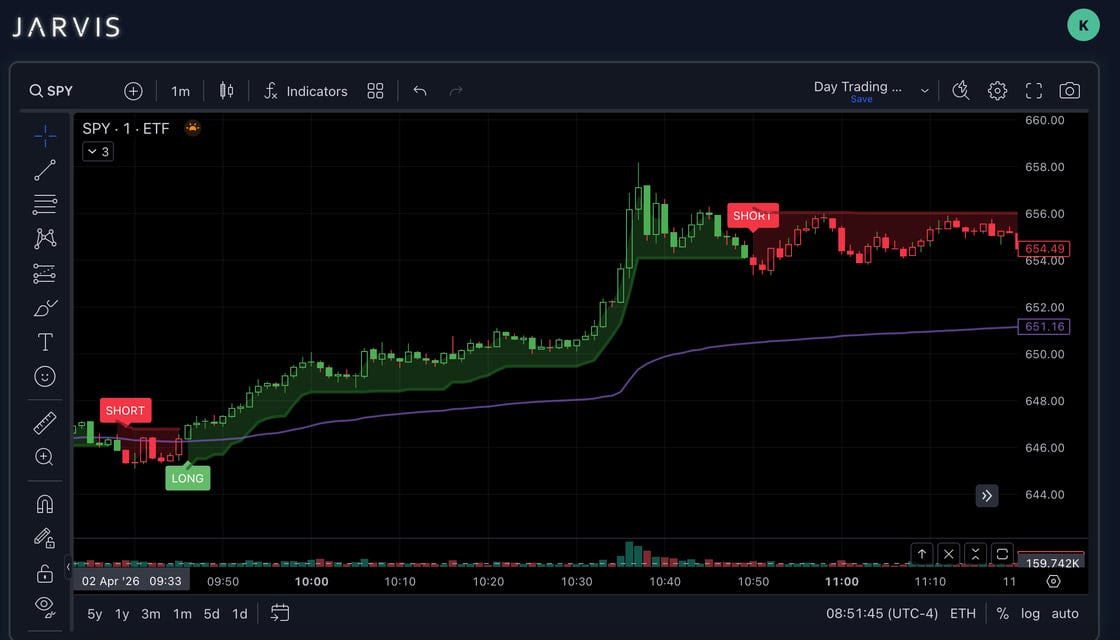
April has been all about identifying trends and trading with them. A LONG tag on a 15Mtimeframe is a good starting place to say that you have a bullish trend. Then, when a 1M LONGtag just above VWAP supports it, like here, it’s the kind of alignment we look for on trend + tag agreement.
This trade matured steadily but really finished with a flourish that locked in a lot of profit forentries at the LONG tag. The SHORT tag preceding it presented some interest and would havelost money. But again, the daily trend was positive, so the trade we were really looking for, we got.
TRADE 2
Day Trade Options | Timeframe: 1M SPY Call | April 9 | 10:56 am – 12:23 pmC650 $0.74 → $4.17 | 463% profit
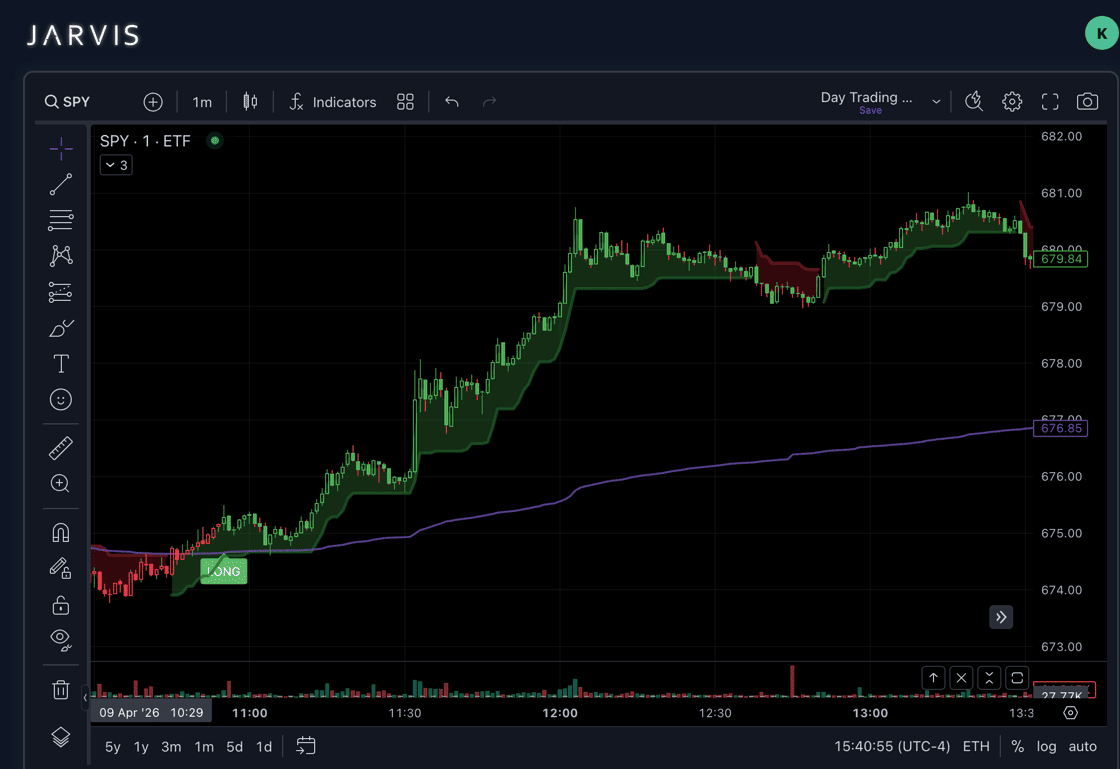
While this looks easy in hindsight, the bottom wicks tested our resolve three times before the11:32 breakout. We rely on the Jarvis cloud to keep things simple, but staying in through bottom tests still requires discipline.
Usually, we look for a cloud break to exit a trade, but with options you also fight decay (more onthat in our next trade). When an extremely profitable position starts to stall, notice the greencloud flattens twice before our 12:23 exit, we don’t like to wait around and give away more profit.We exit this one mid-stall. Huge signal success.
TRADE 3
Day Trade Options | Timeframe: 1M SPY Call | April 24 | 10:40 am – 12:08 pmC712 $0.71 → $1.96 | 176% profit
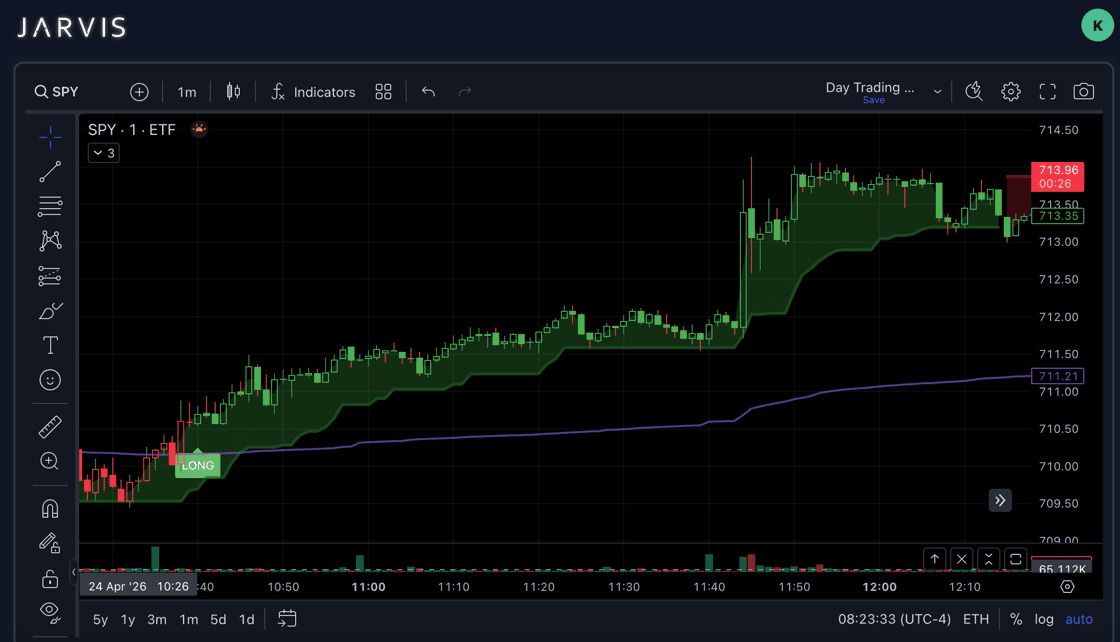
When day trading options, time decay erodes gains. A stock price gaining modest value may accompany an options instrument that loses value. Just before the huge extension candle, this trade would only have us up only 30% in over an hour. Not optimal for the risk we carry on asame-day expiration instrument.
Once we get a candle that launches our position past 150% profit in a minute, we’re asking how much of it we want to protect. We don’t mind traders exiting even as soon as that candle closes (that would be +200%). But we take the Jarvis cloud break as our standard exit, and we’re content.
Trusting a strategy and winning because of it is the victory that matters most.
The Lesson: The Trend Is Your Friend
Wealth Through Diversification
Being bearish when the market is at an all-time-high is a common fear for traders speculating in territory the market has never tested before. But look at the history on an ETF like SPY. Breaking new highs is what the market, in the long term view, has always done.
The most valuable information you can have, then, is knowledge of the market trend. Our stream this month focused on how Jarvis can showcase trend + signal agreement for even higher-conviction trades.
You saw a few of them here, and we invite you to see the next ones with us live on our daily stream. All free trial members have access. Sign up below, we’d love to see you there.
It's a great day to trade.
[Log in]
Risk Disclosure: Trading stocks, options, futures, and cryptocurrencies involves substantial risk and is notsuitable for every investor. An investor could potentially lose all or more than the initial investment. Risk capital is money that can be lost without jeopardizing one’s financial security or lifestyle. Only risk capital should be used for trading. Past performance is not necessarily indicative of future results.
CFTC Rules 4.41: Simulated performance results have inherent limitations. Unlike an actual performance record,simulated results do not represent actual trading. Since trades have not been executed, results may have under- or over-compensated for the impact of certain market factors, such as a lack of liquidity. Simulated trading programs are generally designed with the benefit of hindsight. No representation is being made that any account will or is likely to achieve profits or losses similar to those shown.
Disclaimer: The information and trading signals provided by KTS Trading, LLC are for educational and informational purposes only and do not constitute investment advice or an offer or solicitation to buy or sell any security. We do not execute trades, manage accounts, or guarantee results. All trading decisions are made solely by you at your own risk. You should consult with a licensed financial advisor before making any investment decisions. KTS Trading, LLC is registered with the U.S. Securities and Exchange Commission.